
The White House CEA put out a fairly deranged report on socialism yesterday. Alongside its discussion of the ways in which a national health program is reminiscent of Mao and Lenin, the report authors also spend a considerable amount of time on the Nordic countries.
The report’s overall position on the Nordic countries is a bit perplexing. On the one hand, they say that the Nordic countries are not actually very socialist. On the other hand, they spend a lot of the report saying the countries have terrible outcomes.
I have grown accustomed to seeing conservatives waffle between the claims that (1) the Nordic countries are socialist and have terrible outcomes and (2) the Nordic countries have good outcomes but are very capitalist. But I have never seen a conservative synthesize the two statements into the claim that (3) the Nordic countries are capitalist and have terrible outcomes. This statement neither makes the case for capitalism nor against socialism. If anything, it appears to say that capitalism is bad.
Consumption Measure
But aside from that more abstract discussion, the part of the report that interested me most was its effort to compare standards of living across the countries by using an “actual individual consumption” measure.
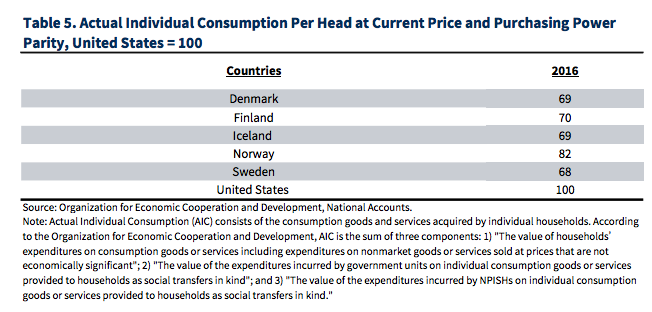
According to this measure, Danes, Finns, and Swedes have a standard of living that is 30 percent worse than Americans. For Norwegians, it is only 18 percent worse.
This measure, like many of the statistics produced in the report, is preposterous. To see just how ridiculous it is, I have produced my own consumption measure that more accurately reflects the differences between the countries. My measure differs from the CEA’s in three important respects:
- It uses total consumption. The CEA measure is based on a concept called “actual individual consumption,” which essentially takes total consumption and then subtracts from it collective consumption carried out in the form of various public services. Assuming that collective consumption is a total loss to individual well-being is ridiculous, question-begging, and biased against countries that do more collective consumption, such as the Nordics.
- It adjusts for excessive health spending. The US spends around twice what the Nordic countries do on health care. This excess spending is a complete loss. It has not generated better health outcomes and has also left 30 million people uninsured. Counting US health care rents as a boost to standards of living is asinine.
- It adjusts for differences in hours worked. Nordic countries work a lot less than America does. And this is intentional on their part. Less work means less production and therefore less “consumption” so measured. But on the flip side, less work also means more free time to consume however you want. Counting their higher levels of free time against them, as the “actual individual consumption” measure does, is biased and wrong.
This is how these adjustments change the relative position of the Nordics to the US when it comes to average consumption.
| Average Consumption Per Head at Purchasing Power Parity (2017), US = 100 | ||
| Country | CEA Measure | 3P Measure |
| Denmark | 69 | 99 |
| Finland | 70 | 91 |
| Norway | 82 | 103 |
| Sweden | 68 | 85 |
| United States | 100 | 100 |
Under this more sensible measure, you find Norway and Denmark are no different from the US. Finland is just 9 percent below. And Sweden is now 15 percent below rather than 30 percent below.
There are two more things to consider here though to get a full sense of the success of the various institutions.
First, you have to consider the distribution of this consumption across the population. The average figures reflected in the graph above take a measure of total consumption and then divide it by the population. But it tells you nothing about how much of that is going to the top of the society versus the middle and bottom of society.
In general, the Nordic countries have vastly more equal distributions, which means that even if the pie is somewhat smaller (as in Sweden), the fact that the bottom and middle gets a larger slice of it means that they are better off than they would be in an American-style system. Also, since consumption generally has declining marginal utility, a more egalitarian distribution produces greater happiness and well-being. It is hard to capture “aggregate utility” in a quantity in the same way as you can average consumption, but clearly if you could, the Nordic societies would post higher scores than America.
Second, when it comes to measuring the success of Nordic institutions, it is important to occasionally consider the fact that these countries are basically like Alaska in their climate and accessibility to the rest of the world. As a result of their difficult location, goods are just generally more costly, just as prices in Alaska are 16.5 percent higher than prices in Kansas.
The reason this matters is because cross-country comparisons of things like total consumption use something called Purchasing Power Parity (PPP) to produce comparable figures. To the extent that the geographical problems of these countries make things more expensive, that does mean that the countries’ citizens consume less as a result. But it would be wrong to conclude that this lesser consumption is a function of their economic institutions. According to Gas Buddy, gas prices are 32 percent higher in Alaska than Kansas, but that does not mean that Alaska has a worse economic system.
I do not try to make some kind of adjustment to PPP in the chart above that accounts for objective geographical contributions to high prices, but if one could make such a thing, then you would again see the Nordics rise relative to the US.