The Census released its annual Annual Social and Economic Supplement (ASEC) today. In it, there is data about the state of health insurance last year. I will have more insights on this topic in the coming days, but for now here are two graphs that sum up the overall picture.

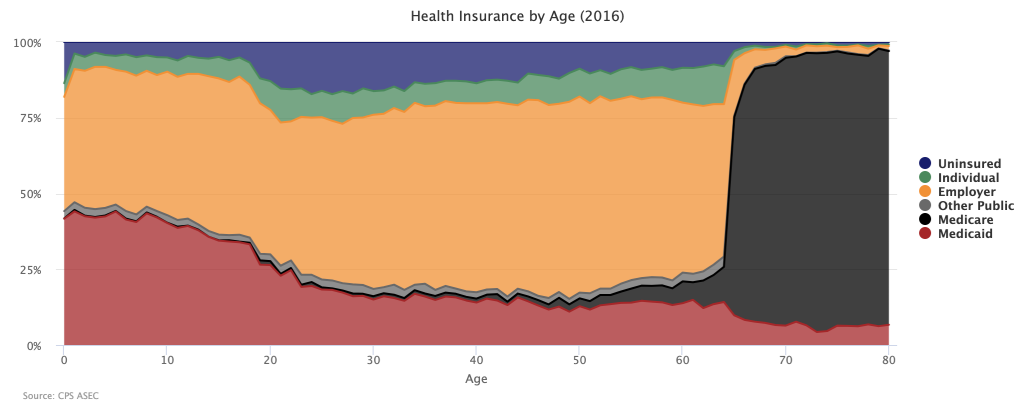
Three things are worth noting for the age graph.
First, as usual, the elderly have virtually universal insurance coverage. This is because we already have a national health insurance program for the elderly called Medicare.
Second, children enjoy the second-lowest uninsurance rate. This is primarily because of Medicaid/CHIP, also public health insurance programs.
Third, for adults between the ages of 18 and 65, uninsurance is highest among youths and then declines gradually as people grow older. This is a predictable pattern because young people tend to have the lowest incomes and are more often in school.

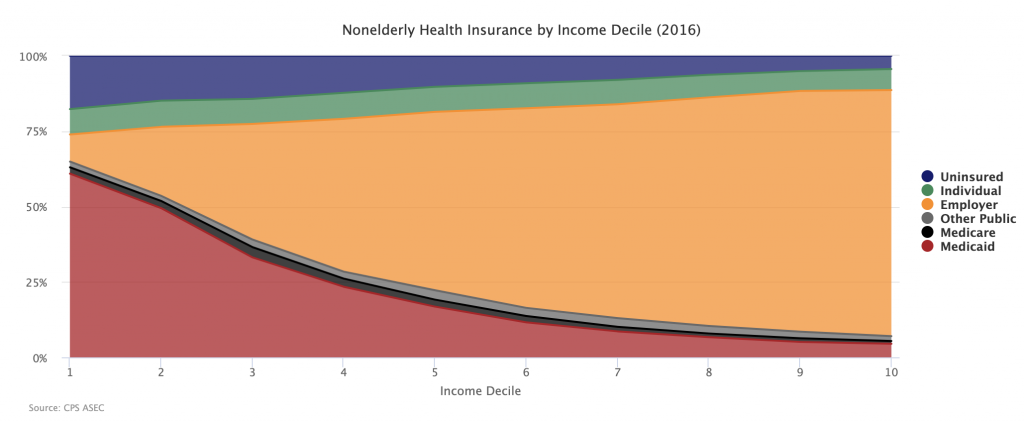
The second graph shows the health insurance situation of nonelderly people broken down by income decile. It is not as straightforward as the age graph above, but it is not that difficult to understand. The first decile (indicated by “1”) refers to those whose per-capita household income is in the bottom 10 percent. The second decile (indicated by “2”) refers to those whose income is in the next 10 percent (so 10th percentile to 20th percentile). And so on until you get to the tenth decile (indicated by “10”), which shows the richest ten percent of people.
As you expect, uninsurance is highest among the poor and lowest among the rich. Indeed, just as with the young above, around 18 percent of our poorest people are without health insurance.
Also as you would expect, Medicaid use is highest among the poor and then tapers off as you move up the income ladder. Those familiar with Medicaid eligibility rules might wonder why Medicaid use does not end abruptly at some point in the bottom half of the income distribution. This is because “income” here refers to per-capita household income, which is a different thing from the income used to determine Medicaid eligibility.
Technical Notes
In assigning individuals to one of the six insurance groups, I follow the method described here by the Kaiser Family Foundation.
To determine income deciles, I take each household’s income in the CPS ASEC file and divide it by the number of people in the household. Then I assign that “per-capita household income” to each member of the household. From there, individuals are sorted into deciles based on where their per-capita household income places them in the overall distribution.

