The poverty discourse in America is a train wreck. You either find people claiming that poverty is a complicated and intractable problem or you find people eager to make dubious claims about how some pet project of theirs will have dramatic anti-poverty side effects. What you rarely find are people willing to shoot you straight about the basic mechanics of where poverty comes from and how to fix it.
This is a shame because poverty is not a difficult thing to get your head around. You can even explain it in a few brief statements: capitalist economies only distribute income to workers and those who own a lot of wealth; many people in society neither work nor own a lot of wealth; and those people very often end up in poverty as a result.
Given this understanding, the obvious fix to the poverty problem is to build up a welfare state that distributes income to those capitalism neglects. This is how low poverty countries around the world do things and this is how we could do things if we wanted to.
Half of the Population Does Not Work
Discussions of poverty will normally start with figures about poverty itself. But in many ways the following graph is far more illuminating.
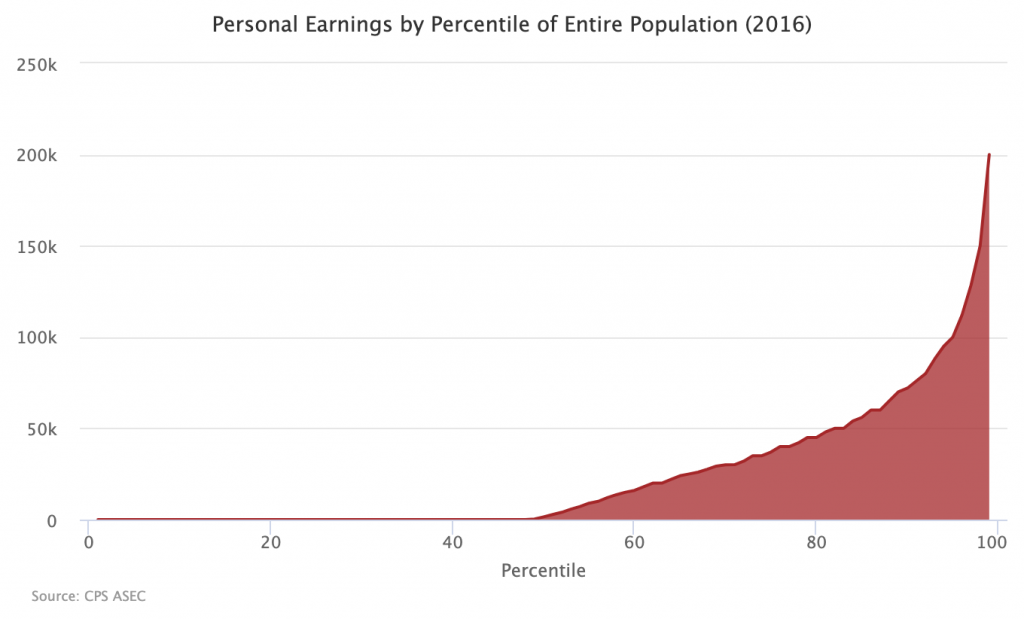
What this graph shows is how much people receive from earnings (wages, salaries, self-employment income, and farm income) at each percentile of the earnings distribution. As you move from left to right on the graph, you notice that every percentile has $0 of earnings until you get to the 49th percentile. This means that around 49 percent of people in society have no labor income. That is, they are nonearners.
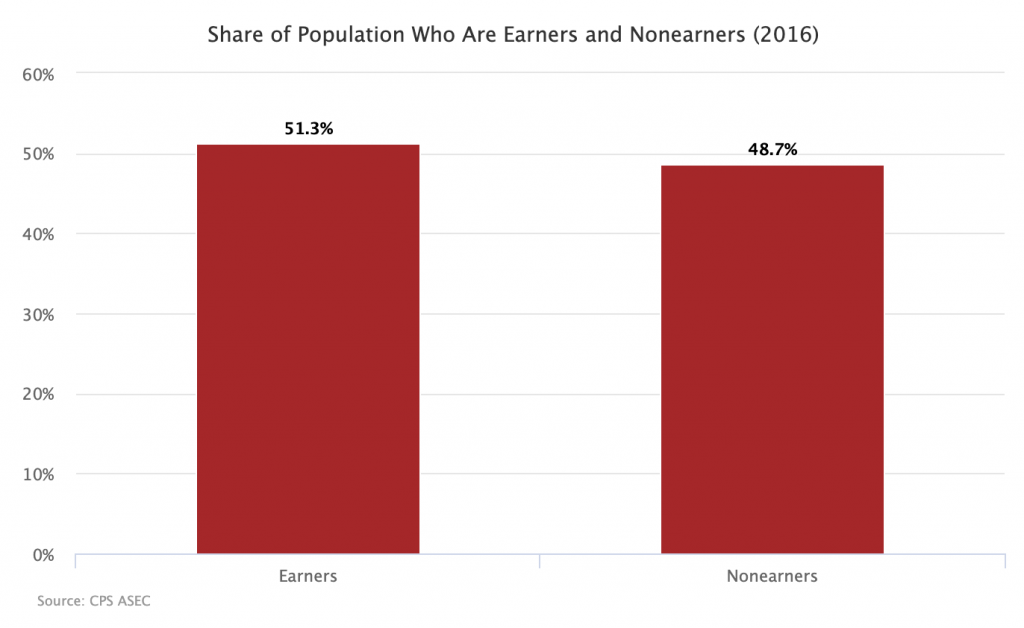
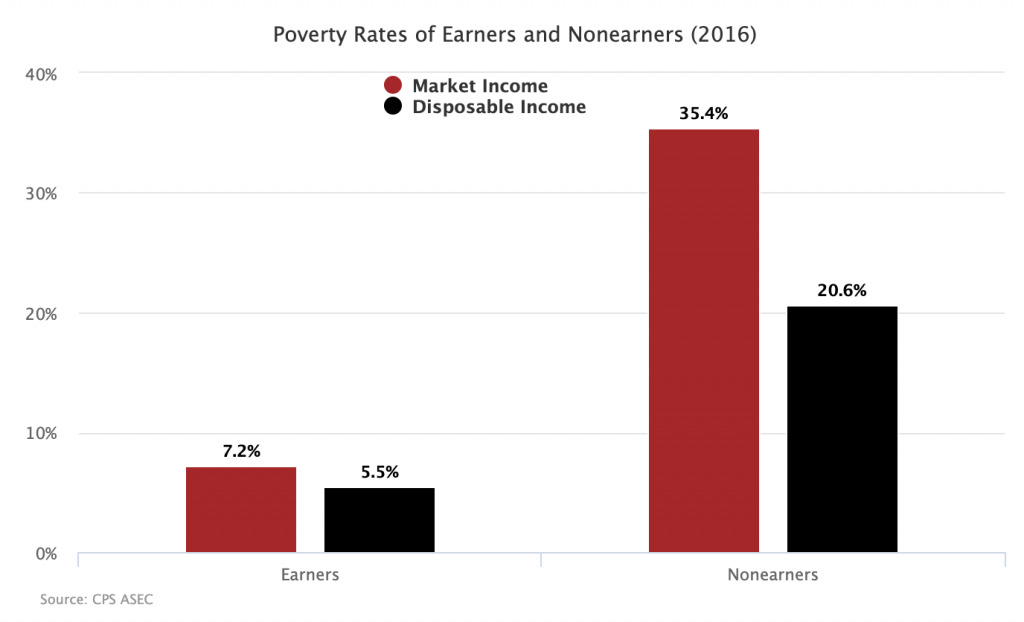
Despite making up a slight minority of the overall population, nonearners make up around 80 percent of all the poor people in the country. This is true if you measure poverty based on market income and true if you measure poverty based on disposable income (meaning market income plus benefits like Social Security).
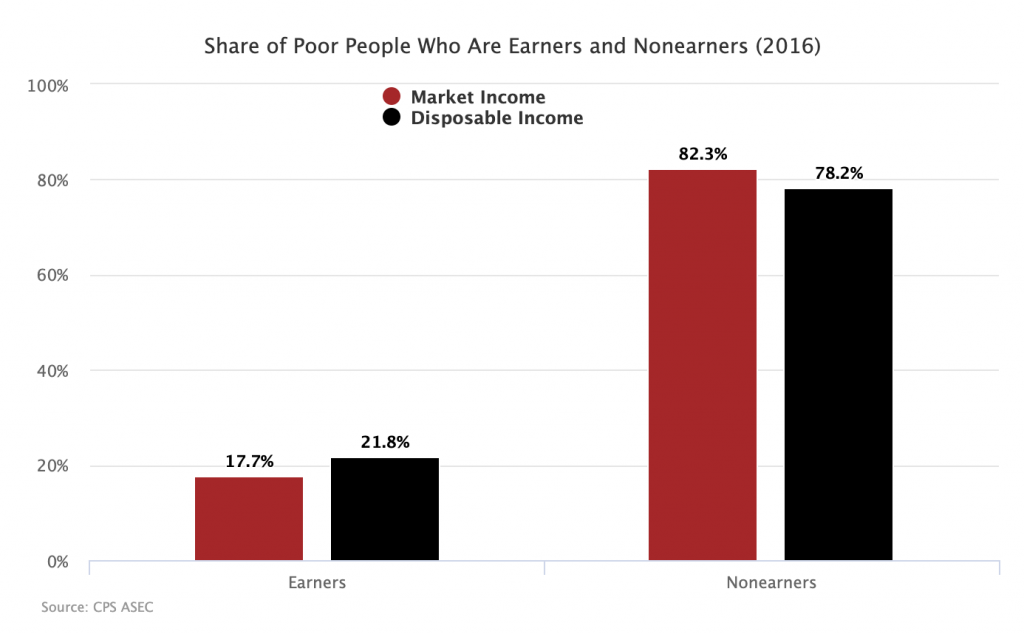
The reason the nonearner share of the poor population is so high is because the nonearner poverty rate is so high. More than one-third of nonearners are in poverty based on market income and more than one-fifth are in poverty based on disposable income. The poverty rates for earners are much lower.
Now, you might think that what this all shows is that to fight poverty we need to convert nonearners into earners. And that is true to some degree: full employment is important and we could do more to make sure people have jobs. But the number of nonearners who could be turned into earners is actually quite small.
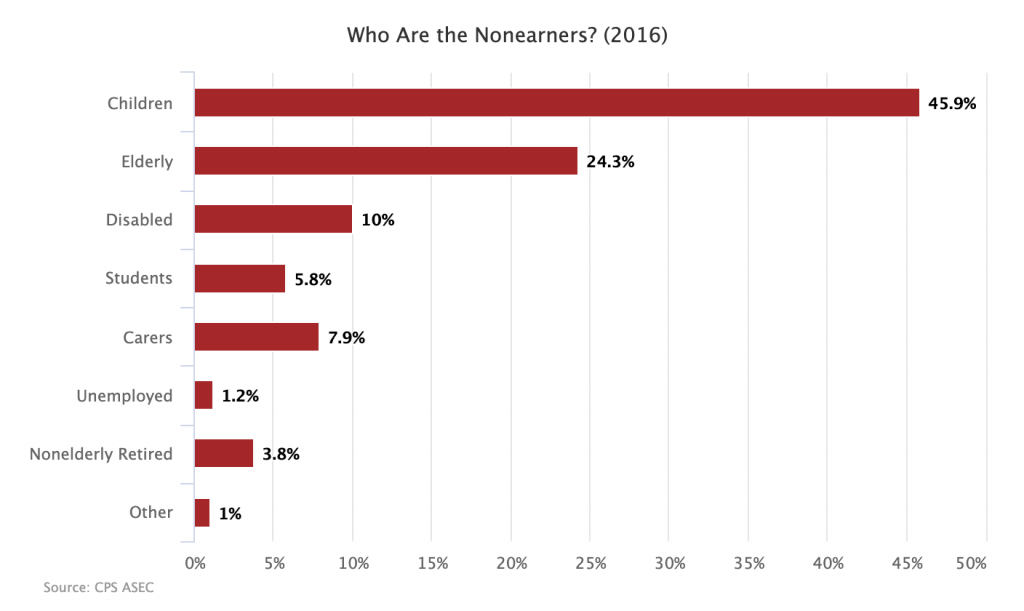
Around 46 percent of nonearners are children below the age 18. Another 24 percent are elderly people aged 65 and above. Ten percent are disabled. Six percent are students. Eight percent are family caregivers. With some exceptions, these are not people who could or should be activated into the labor force.
Who Are The Poor?
If we focus directly on the poor themselves, rather than using nonearners as a proxy for them, we reach the same basic conclusions about who is in poverty and who is not.
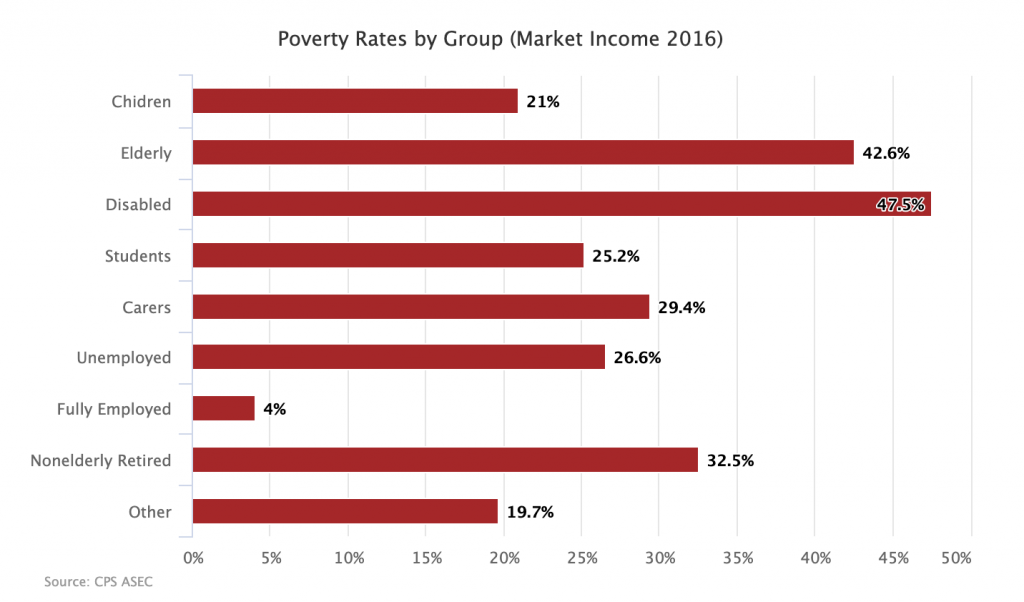
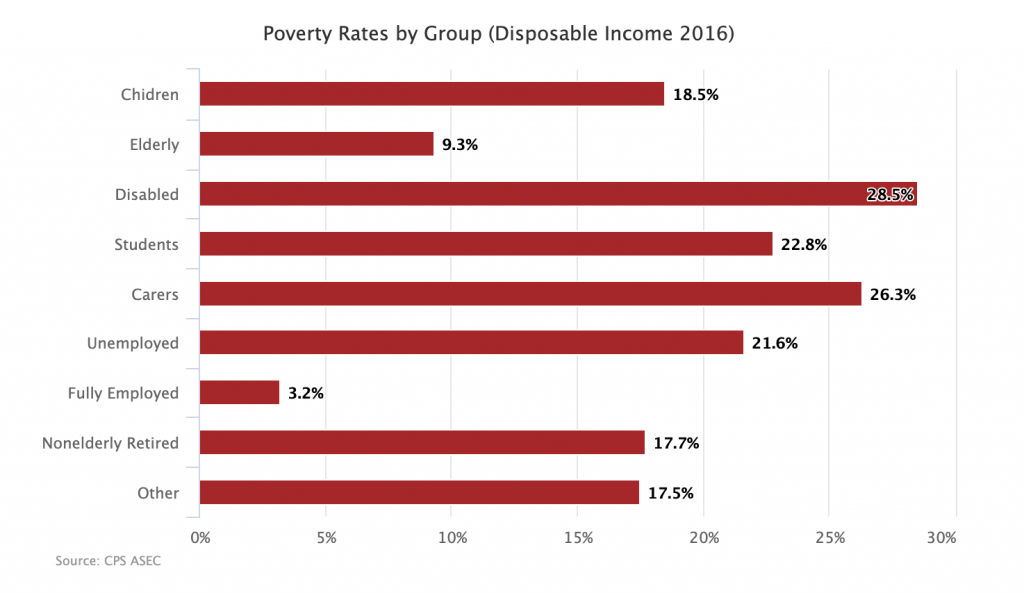
The following graphs break the poor population into 9 groups. The first graph uses a poverty measure based on market incomes while the second uses one based on disposable incomes. Most of the groups are self-explanatory. The exception is Fully Employed, which refers to people who worked 50 or more weeks during the year.
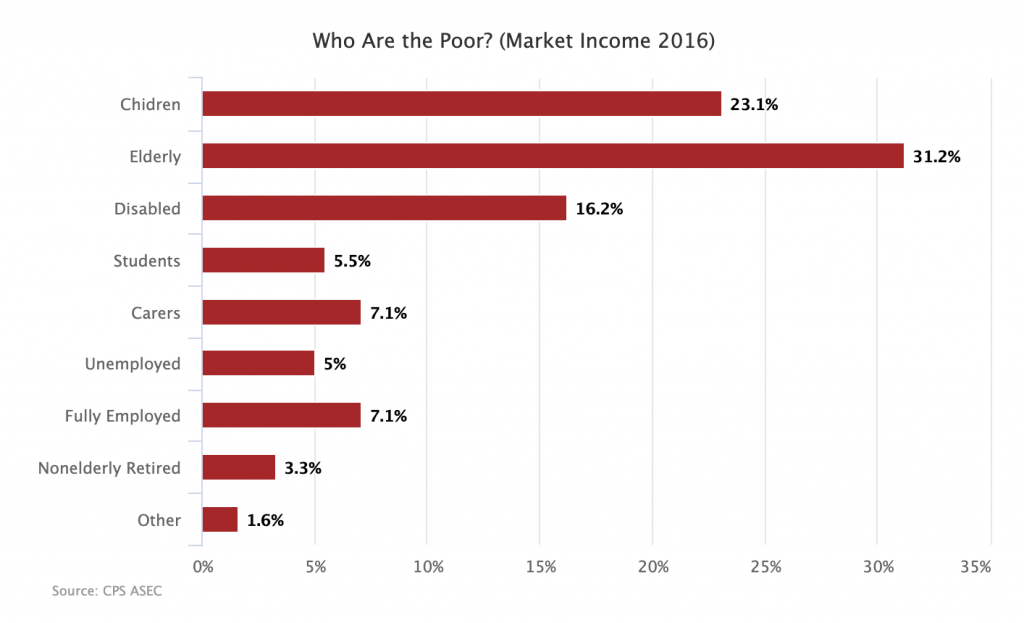
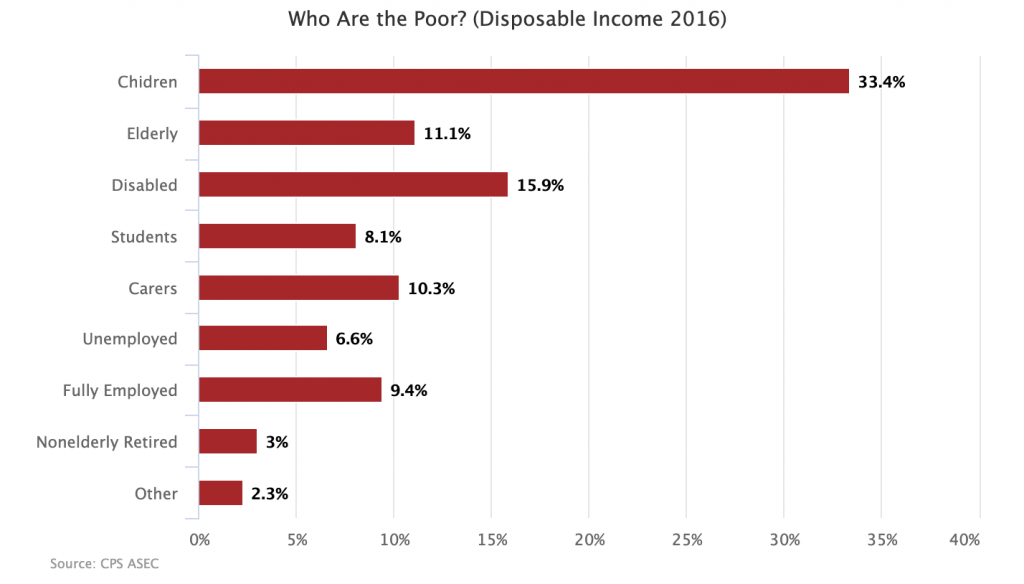
In both graphs, children, elderly, disabled people, and students make up around 70 percent of the poor. If you add in carers and those already fully employed, the number goes to around 90 percent. There is room to activate some of these folks into the labor market, especially carers through the provision of child care and paid leave benefits. But for the most part, the poor are people who cannot and should not work.
Consistent with the section on earners and nonearners above, what you find when you look at poverty rates based on market income is that fully employed people have low rates while everyone else has high rates.
When you look at poverty rates based on disposable income, you see something similar, except that elderly people now have a semi-respectable poverty rate because of Social Security.
The Welfare State Gets The Goods
If the poor are overwhelmingly people who cannot hope to get more income from the market, then it follows that the way to get them more income is through channels other than the market. That means through social benefits provided by a robust welfare state.
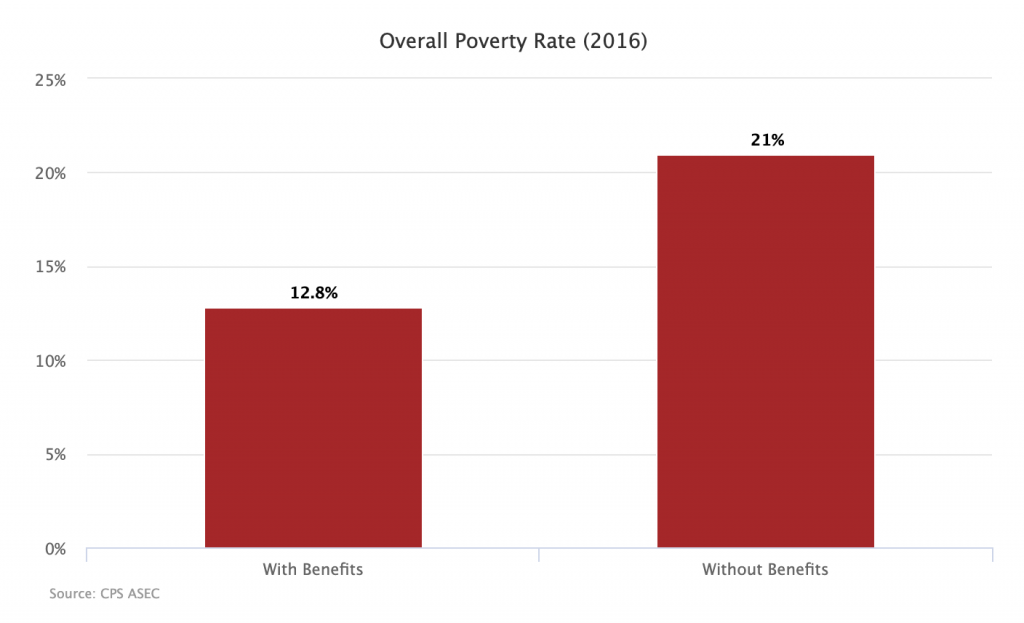
Such benefits already do a lot to hold down poverty. The official poverty rate in 2016 was 12.8 percent. Without benefits, it would have been 21 percent.
If we want to build on that kind of success, what we need to do is to expand the coverage of the welfare state as well as the generosity of its benefits. Every child should get a modest monthly stipend paid to their parents. Minimum benefit levels for old-age and disability pensions should be increased. Students should get a living grant. Carers should get paid leave and caretaker allowances. Unemployed people should get higher benefits and some minimum level of benefits should be available to new labor market entrants who have not yet secured a job. It is through these kinds of reforms that serious poverty reduction will ultimately be made.
Until we come to terms with the fact that market income distributions inherently leave out a massive swath of society, our system will continue to fail its poor people. Markets are not designed to get income to where it is needed. It is up to society to construct programs to do that.
Technical Notes
The poverty figures are derived using the official poverty measure. The Census variable FTOTVAL is used to define disposable income. Market income is disposable income minus unemployment compensation, workers compensation, Social Security, Supplemental Security Income, TANF, and veteran’s benefits.

