

The Federal Reserve released the 2016 version of the Survey of Consumer Finances today. I will be doing a lot of work with this data in the coming months. But for starters, here is a short post about overall wealth inequality.
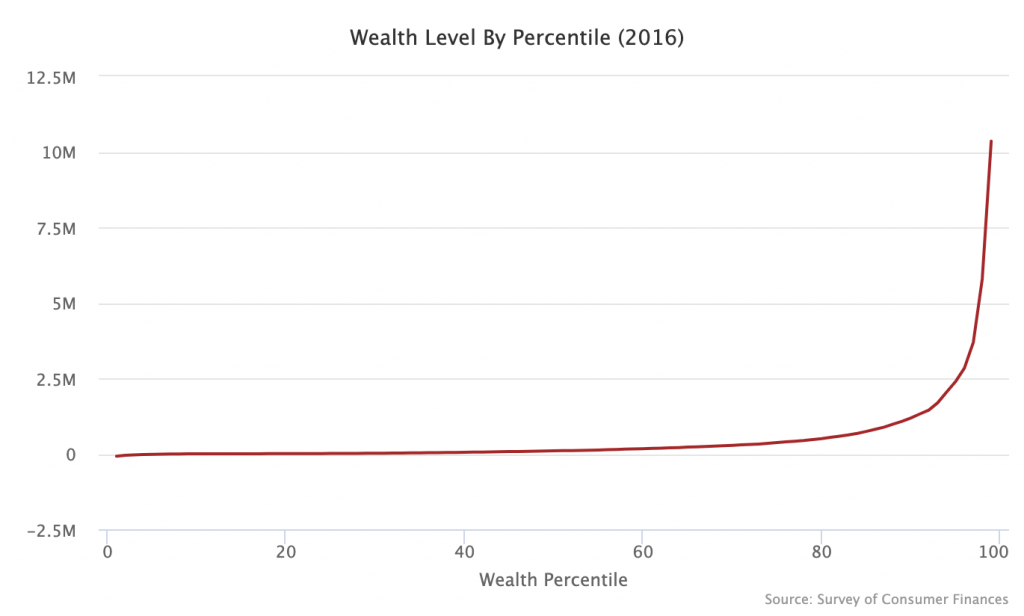
The below graph shows the wealth level at each percentile of the wealth distribution. Since wealth is so overwhelmingly concentrated at the top of society, you cannot see much from the chart itself, but you can hover over the line on the graph with your cursor to see the dollar figure at every percentile.
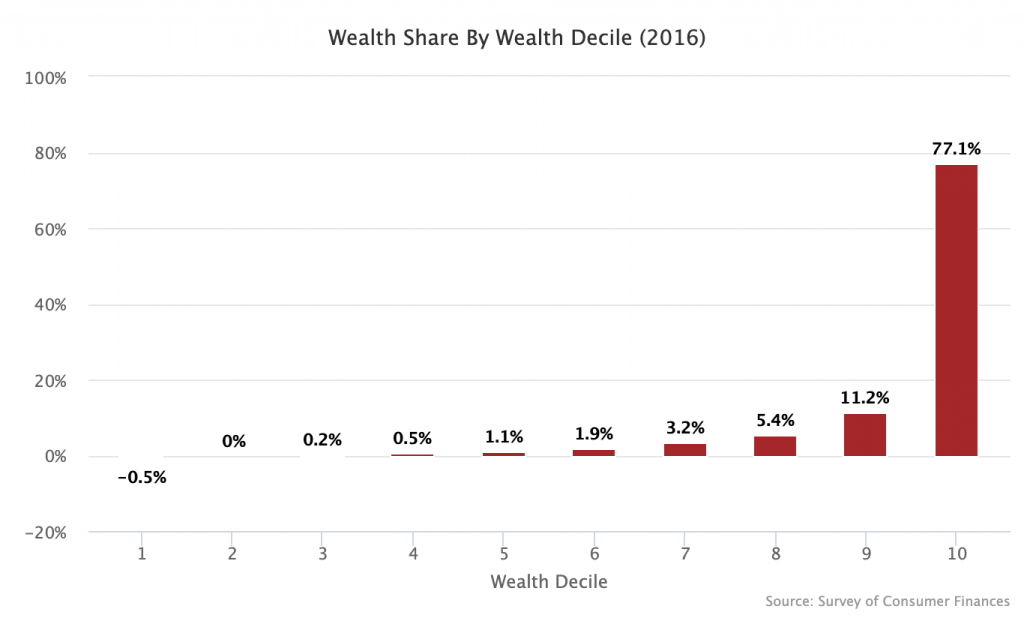
The next graph shows what percent of wealth is owned by each wealth decile. The way this reads is as follows: the bottom 10 percent owns -0.5 percent of the wealth in the country (they are net debtors) while the top 10 percent owns 77.1 percent of the wealth in the country.
Here is what percent of the wealth is owned by the top 1 percent of families.
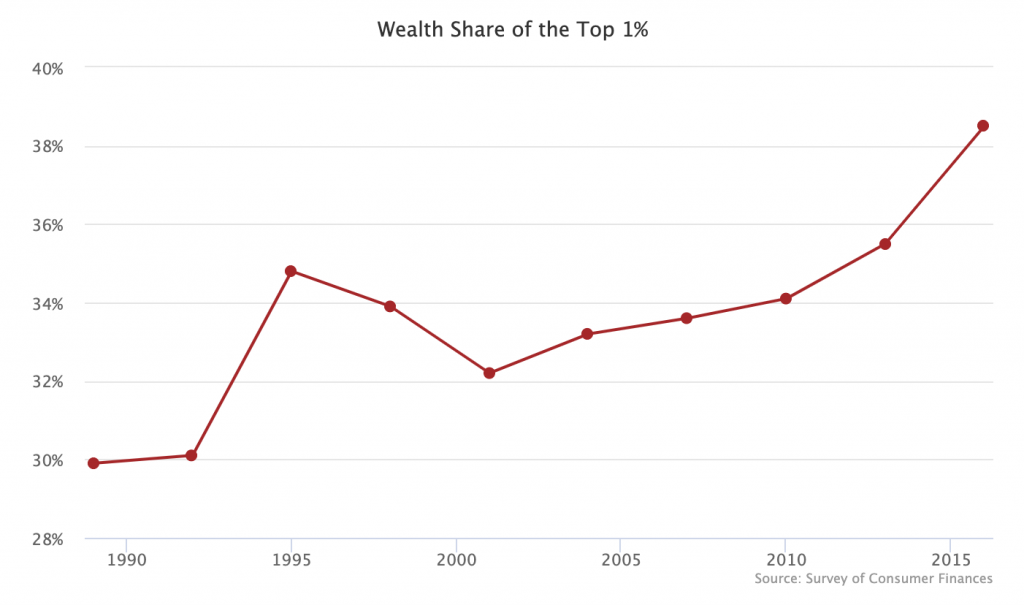
In 1989, the top 1 percent owned 29.9 percent of the wealth in this survey. In 2016, it was up to 38.5 percent.