

Senators Sherrod Brown and Michael Bennet released a child allowance proposal a few weeks ago. The relevant details are as follows:
-
- Children between the ages of 0 and 5 will get $300 per month.
-
- Children between the ages of 6 and 18 will get $250 per month.
-
- Benefits will phase out at a rate of 5 percent for earnings over $75,000 for single taxpayers and $110,000 for married taxpayers.
To estimate the plan's impact on poverty below, I used the 2016 Annual Social and Economic Supplement of the Current Population Survey as well as the 2016 Supplemental Poverty Measure research file.
Using those files, I assign to each person two incomes:
-
- Without CA. This is their current family income as defined by the SPM's income concept. So this is their income without the child allowance.
- With CA. This is what their family income would have been had the Brown-Bennet child allowance been in place. To determine this income, I take the Without CA income, subtract the Child Tax Credit and Additional Child Tax Credit, and then add back to each family's income $3,600 for every child between the ages of 0 and 5 and $3,000 for every child between the ages of 6 and 18.
Poverty Levels
Based on this method, the Brown-Bennet child allowance would reduce the number of children in poverty from 12 million to 6.7 million, a decline of 44 percent.
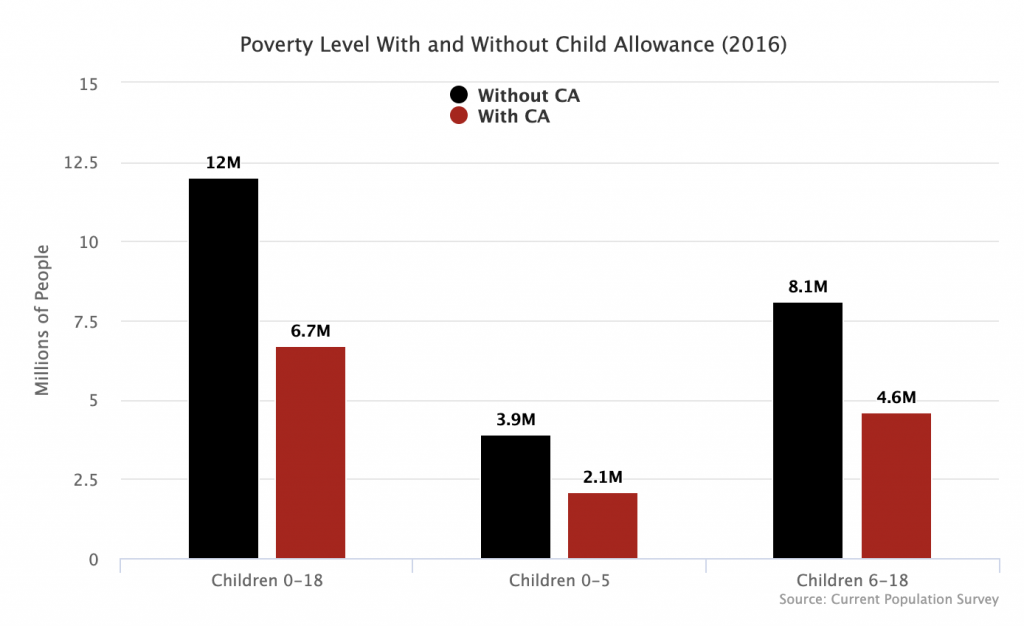
This means that the child poverty rate would fall from 15.4 percent to 8.6 percent.
Income Levels
Looking only at poverty levels and rates understates the full impact of the child allowance idea because it only counts those who are moved over the poverty line by the change. This ignores those in deep poverty who would benefit greatly but not enough to get over the line. It also ignores those just above the poverty line who would also benefit greatly.
With this in mind, the below graph provides a more complete picture of what would happen to children in the bottom half of the income distribution. On the horizontal axis, you have each child income percentile from the 1st percentile to the 50th percentile. On the vertical axis, you have income as a percent of the poverty line.
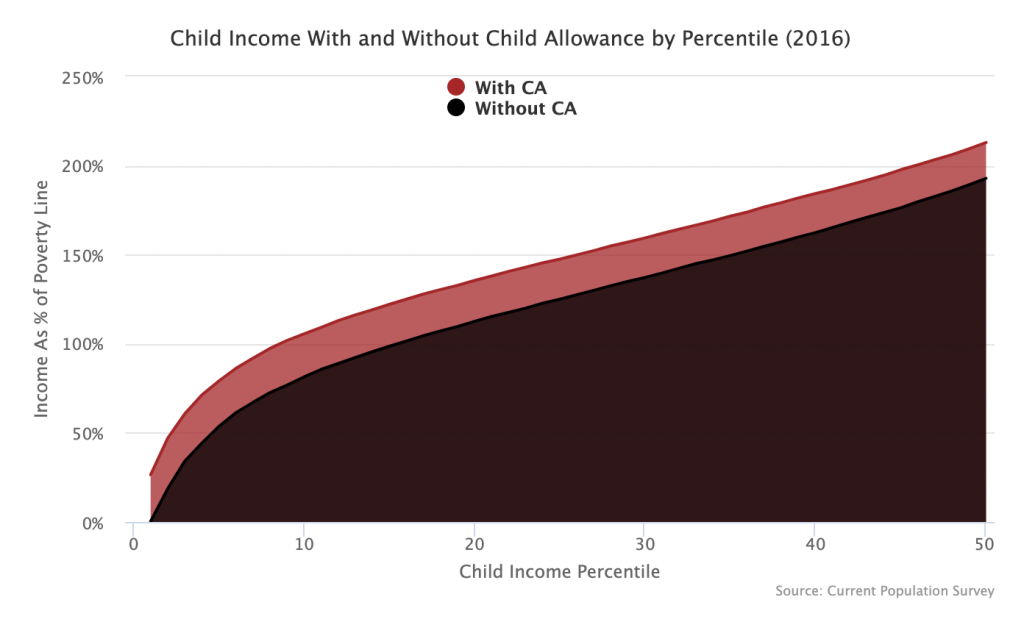
To understand how this graph works, hover over the 5th percentile and you will see a tool tip pop up that says "With CA - 79.1%; Without CA - 53.6%." What this means is that without the child allowance, the 5th percentile child has a family income that is 53.6% of the poverty line. With the child allowance, the income is 79.1% of the poverty line.
As indicated already, the plan pulls children between the 8th percentile and the 16th percentile over the poverty line. But it also dramatically reduces the poverty gap for those below the 8th percentile and significantly improves the lives of many people above the 16th percentile.
Nearly 4 Million Adults Pulled Out Of Poverty
Finally, it is not just children who will benefit from the child allowance proposal. Adults who live with children will also see their economic plight improve. Just under 4 million adults (those aged 19 and over) will be moved over the poverty line by this plan.
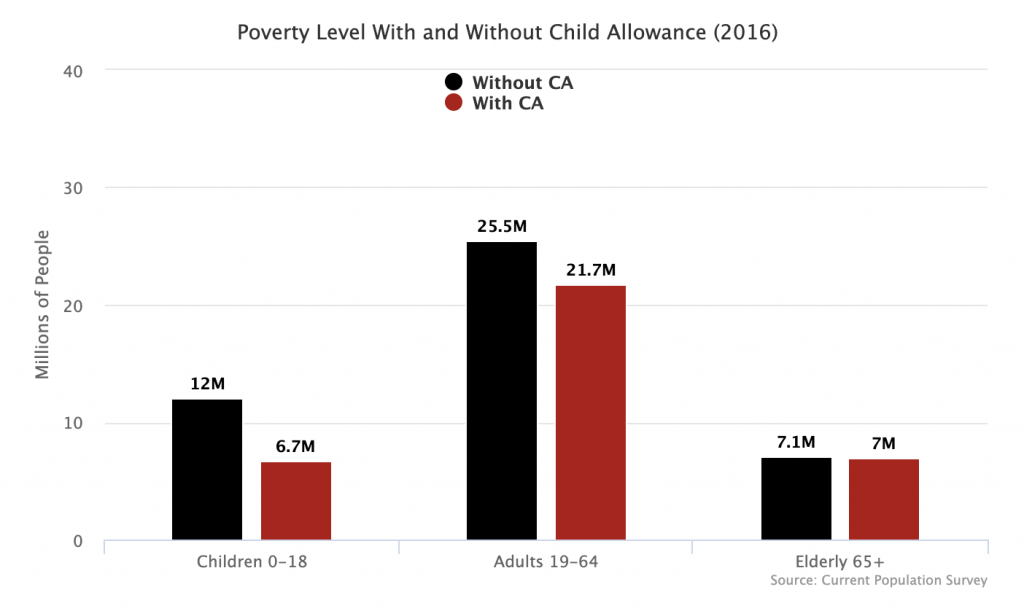
In total, the plan would pull 9.3 million people out of poverty, 4 million adults and 5.3 million children.