

Talks of forgiving student debt via executive action are heating up, with Chuck Schumer recently endorsing the idea before and after the election of Joe Biden. Despite this recent activity, the New York Times reported on Friday that Joe Biden has never publicly supported the idea and claimed that "two people involved in his transition-planning discussions said his views had not changed." Nonetheless, this could become an issue of debate in the coming months, and so, in this post, I provide an updated view of the student debt situation, primarily by using the most recent Survey of Consumer Finances (SCF), which was released in late September.
Aggregate Student Debt
The Federal Reserve tracks aggregate student debt in three ways. The G.19 collects data from institutions that own student debt, primarily the federal government and some private lenders. The Consumer Credit Panel (CCP) collects data from the credit reporting agencies. The SCF collects data from a household survey.
In 2019, the G.19 reported aggregate student debt of $1.65 trillion, the CCP reported aggregate student debt of $1.51 trillion, and the SCF reported aggregate student debt of $1.11 trillion.

The reasons for the discrepancies follow straightforwardly from the limitations of the data sources. The G.19 will register the most student debt because its information comes straight from the owners of that debt. The CCP will miss some student debt because the credit reporting agencies will fail to capture some long-defaulted loans as well as other loans that have not been reported to the agencies. The SCF will miss a significant amount of student debt because it only counts the debt of the core economic unit of each household, i.e. "the person whose name is on the deed or lease at the surveyed address, and all people at that address whose finances are intertwined with those of that person."
In 2019, the aggregate net worth of US households was $111.8 trillion. Thus, the $1.65 trillion of student debt recorded in the G.19 reduced household net worth by about 1.5 percent. This figure has held steady since 2011.

Distributional Limitations
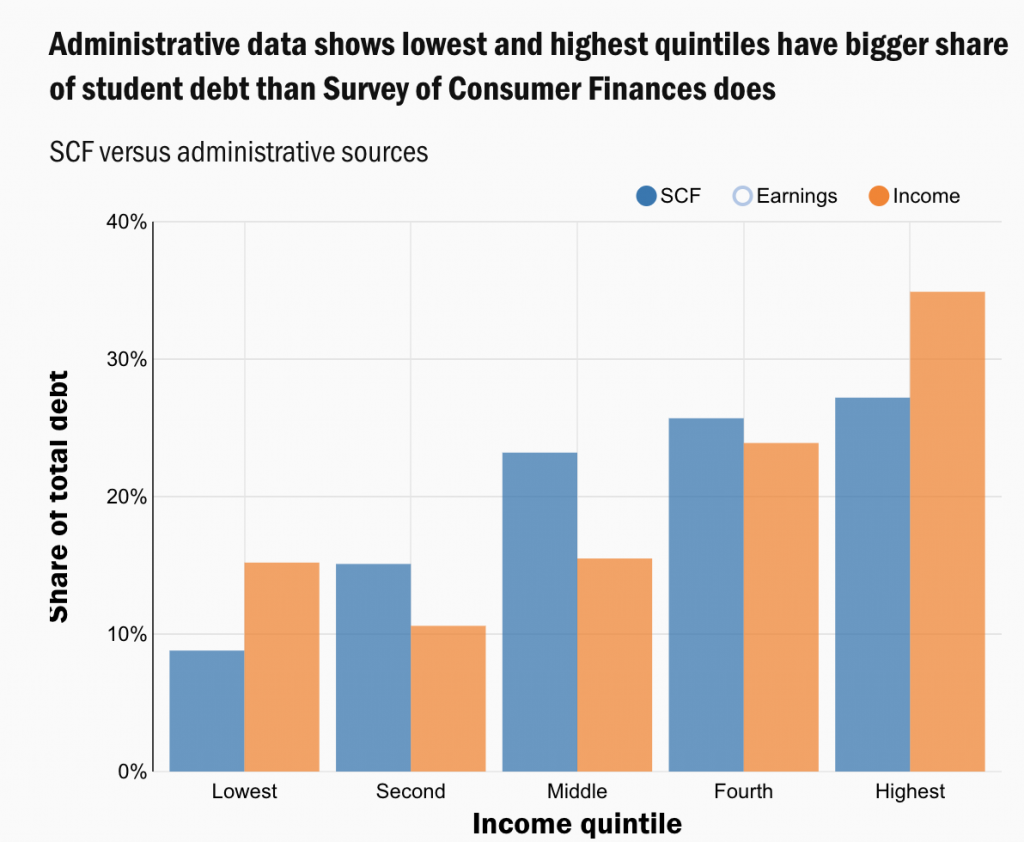
The SCF's limitations obviously make it unreliable as a measure of aggregate student debt, but it is less obvious on first glance whether those limitations also bias its measure of the distribution of student debt. According to Adam Looney's analysis of non-public Department of Education administrative data, they do.
Specifically, Looney shows that the SCF tends to overstate the share of student debt held by the middle 60 percent while understating the share of student debt held by the bottom 20 percent and the top 20 percent.
Presumably similar dynamics are present in other analyses of the student debt distribution conducted with the SCF, though Looney only provides this analysis of the distribution of debt by income.
Nonetheless, the SCF is the only publicly-available data source that provides rich demographic data like age, education, and race, as well as household-level data on assets and debts. So it is still commonly used to illuminate these questions and I will use it for that purpose for the remainder of the post with the caveat that it represents the distribution among adults in a "core economic unit" of a household.
Student Debt by Age
In the following graph, we can see what percent of families have any student debt broken down by age. In the graph, the value at each age is the average of that age and the two ages before and after it. Thus, the value for age 25 is actually the average value of ages 23 through 27.

This graph tells a fairly intuitive story in which around half of young people go off to college and accumulate student debt, which they subsequently pay off at varying levels of quickness. It also partially reflects that student debt levels were lower for prior generations than current generations.
To see the generational difference, we can produce the same graph as above but for different vintages of the SCF.

The shape of each year's curve looks pretty much the same, but the percent of families holding student debt has marched upwards at every age level over time.
Student Debt by Income
If we divide the population into five groups based on their income, we can see how much of the outstanding student debt is owed by each fifth (or quintile). Consistent with prior years, we see that higher income households have higher levels of student debt on average until you get to the very top.

These kinds of analyses often restrict the age range to those between the ages of 25 and 40. So here is the same graph for that age range.

As with the total population graph, we see a trend where higher income groups have more student debt. There is no dip for the richest quintile, but there is a dip at the top if you use smaller slices than fifths.
Student Debt by Wealth
If we look at wealth quintiles instead of income quintiles, the story flips. Across the entire population, the least wealthy fifth owes over half of the student debt while every other fifth owes 7 to 14 percent of it.

Restricting the graph to ages 25 to 40 produces similar results.

The fact that student debt is concentrated among the least wealthy follows intuitively from the fact that student debt is a liability that drags down an individual's net worth. Thus, you could say these graphs merely illustrate that people with student debt have student debt. But from a political perspective, it may make a difference in how people experience or view the issue.
One way to at least somewhat escape the circularity of aggregating student debt by wealth is to aggregate student debt by assets. That is, break all the households into five groups based on the value of all the assets they own while ignoring their liabilities and then see how student debt is distributed among those groups.
The following graph shows the distribution of student debt by asset quintile for the entire population. Unlike the wealth graph above, this figure places a disproportionate amount of student debt in the middle 60 percent of asset owners with the top and bottom 20 percent owing less.

Here is the same graph for ages 25 to 40.

For this young-adult age group, we see a graph that looks more similar to the income graph than the wealth graph, meaning that groups that are more asset rich owe more debt than those that are less asset rich.
Student Debt by Education
The following graphs show the distribution of the population and distribution of student debt by education level. As you would expect, population share declines as education level increases while student debt increases as education increases. Population share in this case means share of households headed by someone with that level of education.


Student Debt by Race
The following graphs show the distribution of the population and distribution of student debt by race. Across the whole population, only black people owe a disproportionate share of the student debt. Across ages 25 to 40, black and white people owe a disproportionate share of the student debt, with Latinos being very disproportionately free of student debt.


Pondering Student Debt Forgiveness
The recent calls for student debt forgiveness have been supercharged by legal theories that the executive can do it unilaterally. These theories do not say that all student debt could be forgiven, only student debt that is currently owned by the federal government.
At the highest level of abstraction, the debt forgiveness proposal essentially consists of the federal government wiping $1+ trillion off its balance sheet in order to add $1+ trillion to the balance sheets of certain households, as illuminated by the graphs above.
Stimulus Policy
One argument recently circulated for this proposal is that it would act as an effective stimulus to pull us out of the coronavirus recession (I, II). While it is nice to make topical arguments, if we are being honest about things, student debt forgiveness is possibly the least effective stimulus imaginable on a dollar-for-dollar basis. Normal stimulus measures try to put money in people's pockets so that they can spend it. But student debt forgiveness does not do this. It's like giving out $1+ trillion that is then immediately garnished by creditors, leaving households with no extra liquid cash to spend.
To the extent that student debt forgiveness could provide a short-term stimulus, it would be through keeping people's monthly student loan payments in their pockets. But student debtors only pay a small fraction of the outstanding student loan balance each month and student loan payments have already been suspended.
In the best case scenario, student loan forgiveness might induce people to borrow money to fuel consumption, though private loans for household consumption are pretty limited.
So it does not really make sense as a stimulus measure. Almost any other conceivable use of the same amount of money would be more stimulative and some obvious uses, like another round of expanded unemployment benefits and direct cash payments to households, would be massively more stimulative. Of course, if you get to the point where basically nothing else is possible, which could very well be where we wind up due to the Congress, then perhaps you say "it's not much but it is better than nothing."
Distributive Policy
Stimulus is not the only reason for doing policies and the call for student debt forgiveness long precedes the coronavirus recession. So it is probably better to assess the program as a distributive policy rather than a stimulus policy.
In pondering the merits of this kind of policy as a distributive move, two potentially unfair asymmetries stand out.
The first asymmetry, which we can call the Balance Sheet Decisions Problem, exists within the population of people who attended and paid for college. All people who attend and pay for college end up carrying a tuition-sized hole in their personal balance sheet for the rest of their lives. But insofar as balance sheet items are fungible, they don't all carry that hole in the same way.
Some carry the tuition-sized hole in the form of student debt that they still owe to the federal government. Others carry it in the form of student debt that they refinanced with a private lender like SoFi. Others carry it in the form of other debts that they did not pay off because of the money they spent on college (whether at the time they went to college or when they subsequently serviced their student debt). Others carry it in the form of foregone assets that they did not build up because of the money they spent on college. The tuition-sized hole is the same, but the form it takes is very different person to person.
A less abstract way to understand the Balance Sheet Decisions Problem is to look at what percent of student debtors currently have a positive net worth. In the 2019 SCF, 65 percent of the households with student debt, which together owe 46 percent of all the student debt, have a positive net worth. This means that they could already eliminate their student debt if they were willing to liquidate their assets and use their cash to pay off their student debts. Student debt forgiveness creates an obviously unfair asymmetry between someone who decided to put surplus income into their 401k and home equity while carrying their student debt and someone who decided to forego 401k contributions and buying a house in order to put the same surplus income towards paying their student debt.
As it stands, the student debt forgiveness proposal that relies solely upon executive action only repairs the balance sheets of people who continue to carry student loans owned by the federal government. This means that it does not repair the balance sheets of those who have made different decisions about where to carry their tuition-sized holes.
The second asymmetry, which we can call the College Nonattender Problem, exists between people who did and did not attend college. Student debt forgiveness boosts the balance sheets of people who attended college while doing nothing for people who did not attend college, even though the latter is, on average, worse off in many respects. If the government is going to sprinkle $1+ trillion of net worth onto household balance sheets, should it really do so in a way that leaves out those without college educations?
The College Nonattender Problem can be more easily waived off than the Balance Sheet Decisions Problem. After all, if we believe unfree college is a specific harm whose victims deserve some kind of remedy, then it is simply irrelevant that other people harmed in other ways are not included in that specific remedy. Their harms should be addressed in their own way. But while that works as a decent conceptual counter to the problem, it may not be so successful when it comes to the politics of the policy, which could very easily alienate those who never attended college.
The fact that this kind of forgiveness, and only this kind of forgiveness, is arguably possible through executive action while other more ideal policy constructions are not may end up being a good-enough answer to these issues. In a decent political system where governments are allowed to form and do the things they want to do, you probably would never design a program exactly like this. But in a system where "creative executive action" is all that is possible most of the time, it is much more conceivable that this one could squeak through, even though Biden's team currently says he is opposed.