

The Federal Reserve released the 2016 Survey of Consumer Finances today. This is the first wealth survey of its kind since 2013. By comparing the 2007 and 2016 versions of the SCF, we can see roughly how the various racial groups fared under Obama.
What you see in the below graphs is that the top 2 percent of black families improved their position; the top 2 percent of Latino families improved their position; and the top 22 percent of white families improved their position. Virtually everyone else was worse off in 2016 than in 2007 in terms of their family's net worth.
Here is the change in white wealth between 2007 and 2016 at every white wealth percentile. Hover your cursor over the line in the graph (and the two subsequent graphs below) to get the dollar figure for each percentile.
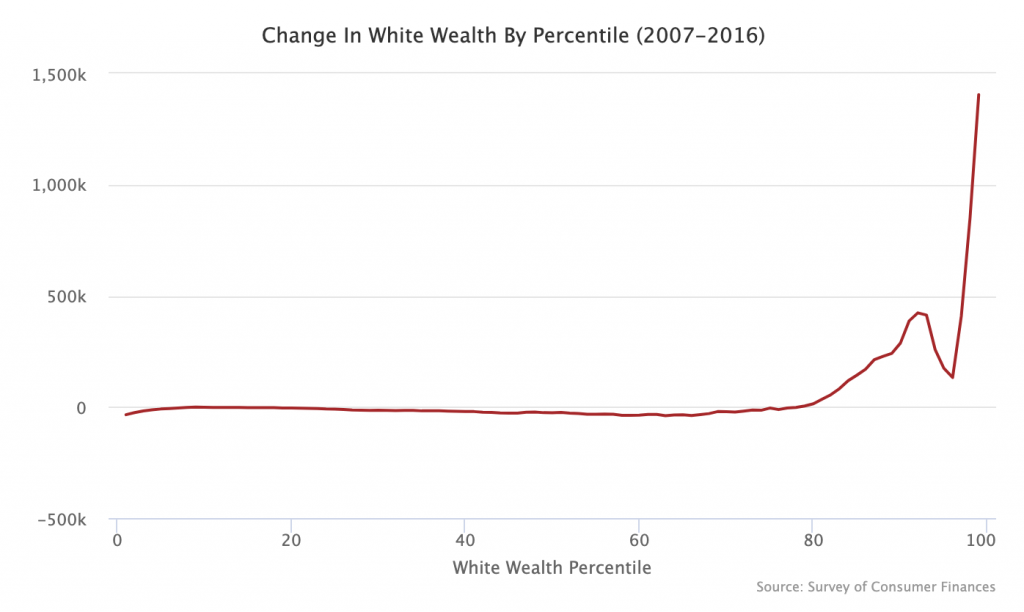
The median white family lost $26,000 under Obama while the 99th percentile white family gained $1.4 million.
Here is the same graph for black wealth.
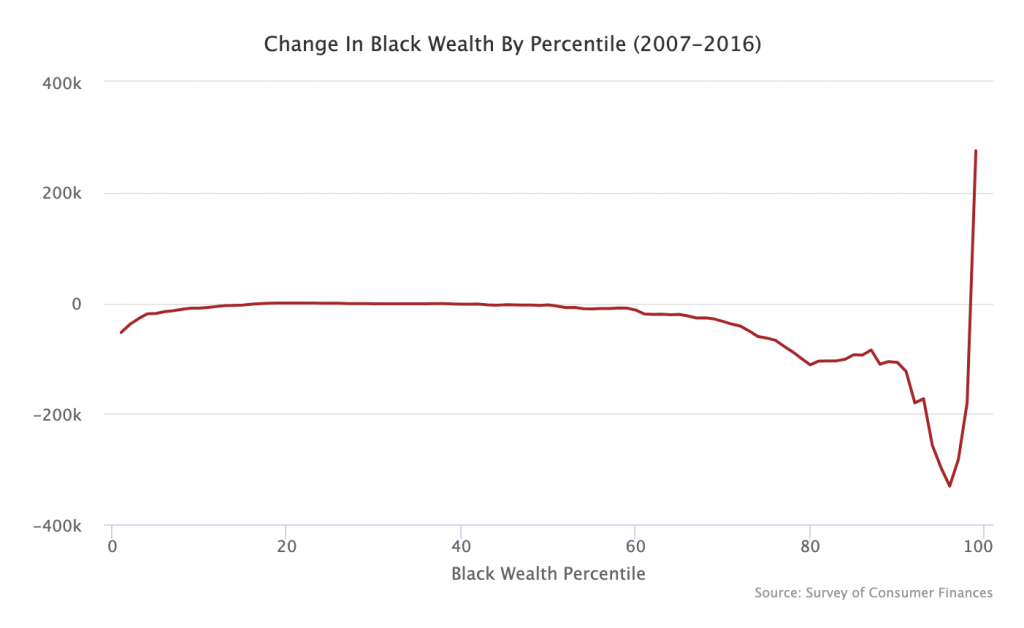
The black 99th percentile added $275,000 of wealth under Obama while every other black family lost money, including steep losses among most of the black upper class.
Finally here is Latino wealth.
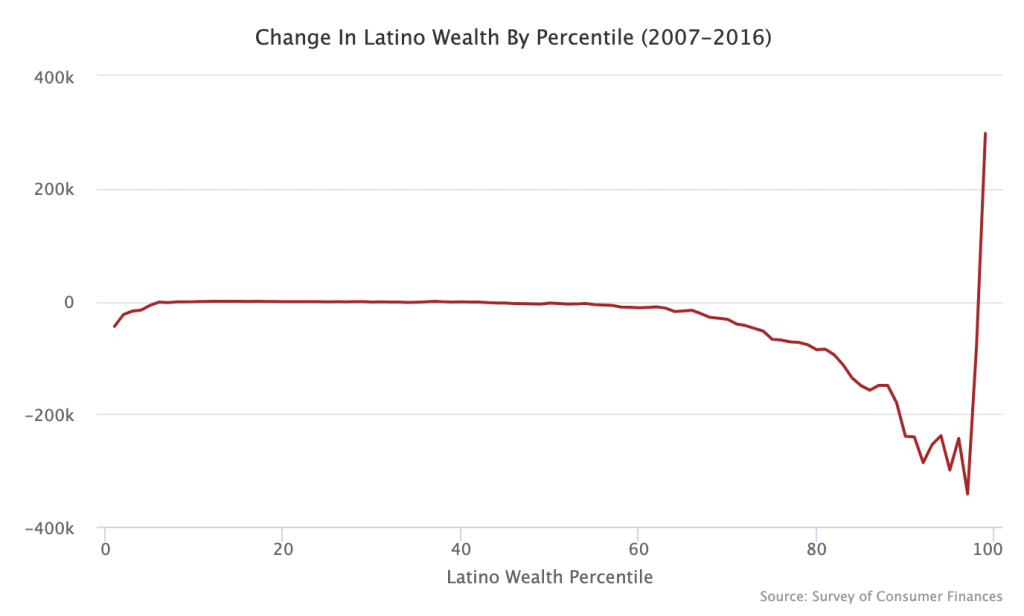
The pattern here is similar to black wealth. The 99th percentile of Latinos added about $300,000 of wealth under Obama while every other Latino family stood still or lost ground.